Use Xdebug in Local with PhpStorm
Local supports Xdebug in PhpStorm by default using zero-configuration debugging.
You do not need to modify php.ini files or install browser extensions and Local add-ons.
Before you start
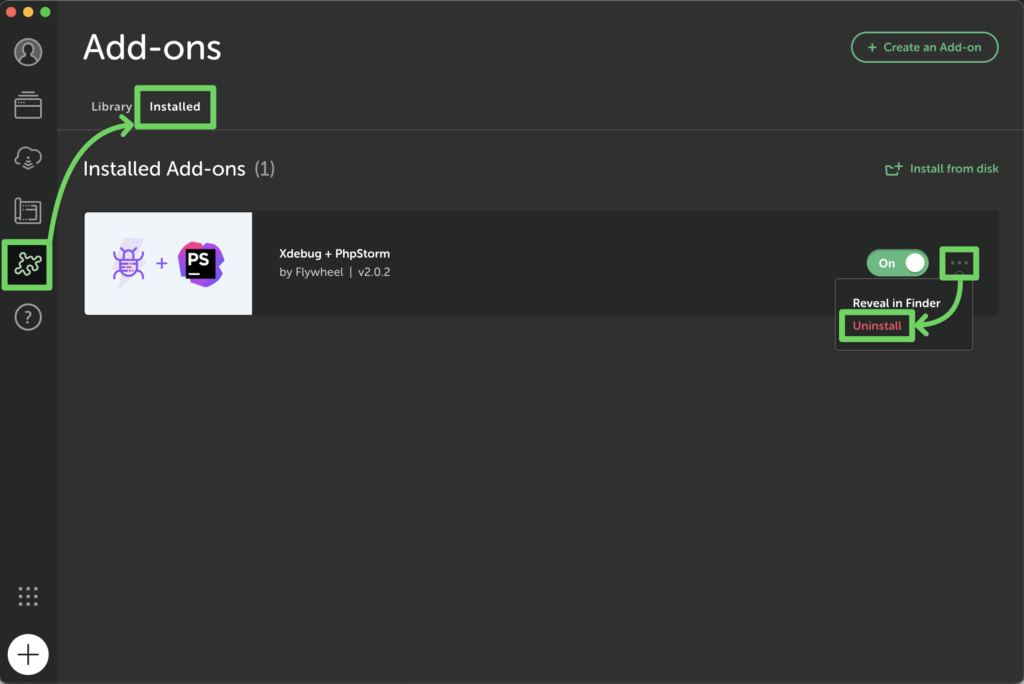
⚠️ Remove the old Xdebug + PhpStorm add-on if you see it under “Installed Add-ons”. It is no longer needed to use Xdebug with Local and PhpStorm.
Set up PhpStorm for your Local site
For each Local site that you want to use with Xdebug and PhpStorm:
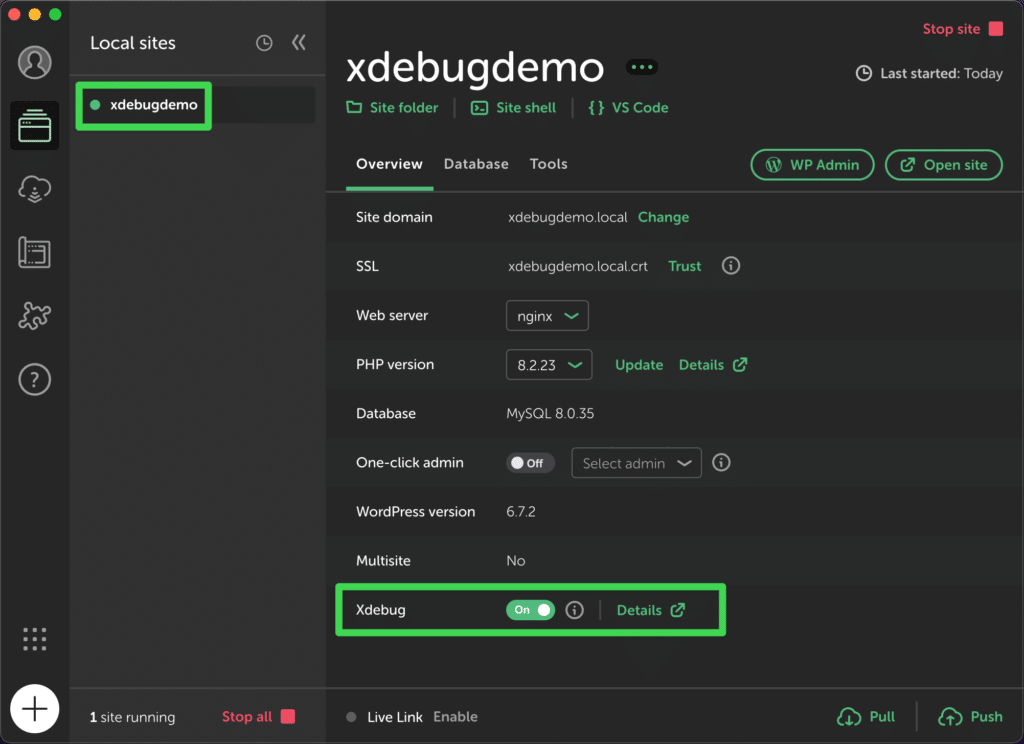
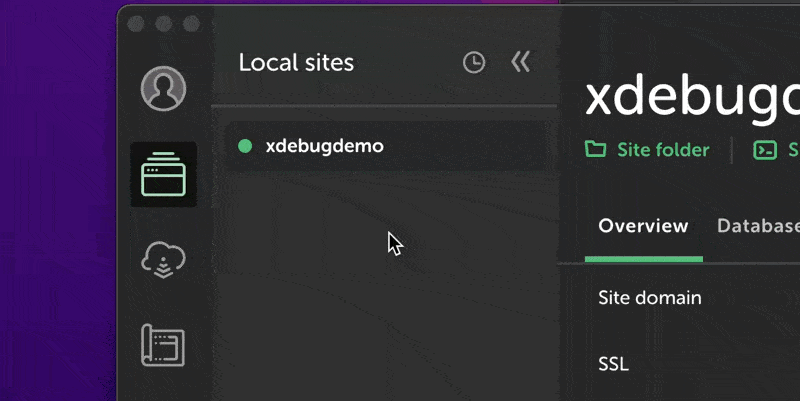
1. Local: Enable Xdebug in the site overview
Xdebug is disabled by default because it can make pages load more slowly. Change the Xdebug toggle from “Off” to “On” in your site overview when you want to use Xdebug. Your site will restart if running. Start your site if it’s not running after you turn Xdebug on.
2. PhpStorm: open your site’s ‘app/public’ directory
Click “Site Folder” in Local, open the “app” folder in your file explorer, then open the “public” folder in PhpStorm. Click “Trust Project” if prompted. It’s important to open the public directory, not the app or other directories, so that Xdebug is able to map your files more easily.
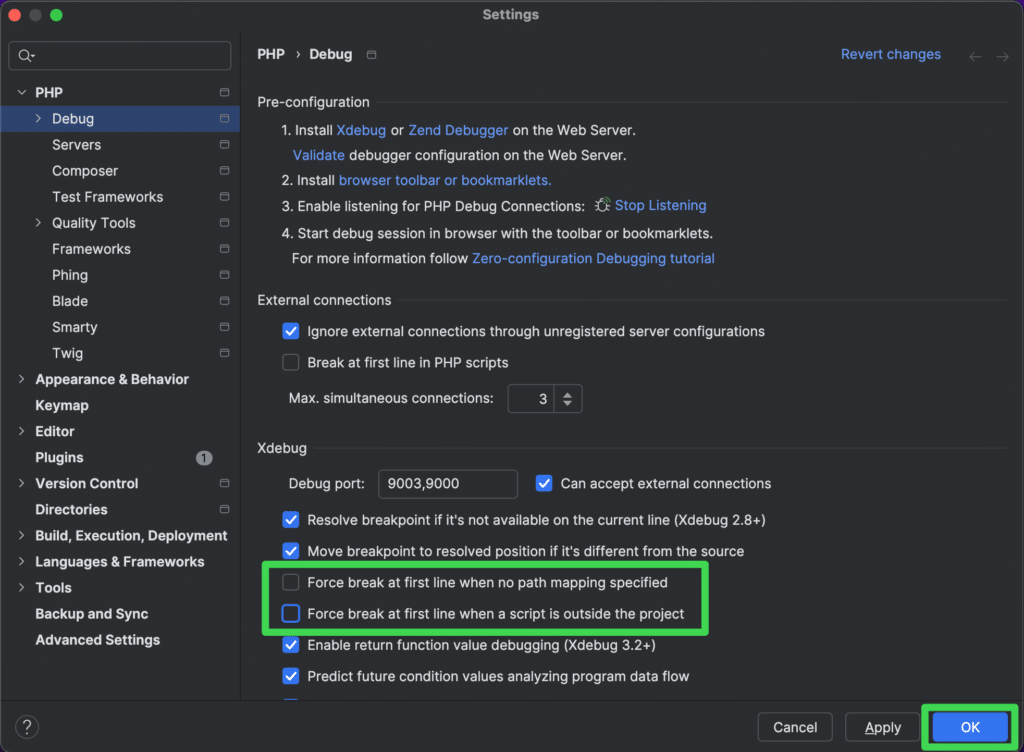
3. PhpStorm: turn off “force break” in PHP debug settings
- Open PhpStorm settings.
- Browse to PHP → Debug and untick both of these:
- “Force break at first line when a script is outside the project”
- “Force break at first line when no path mapping specified”
- Click OK.
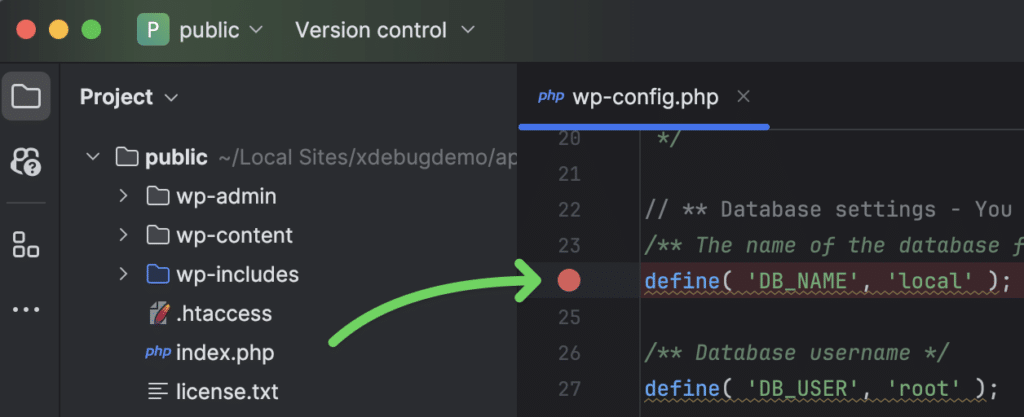
4. PhpStorm: Open a PHP file and set a breakpoint
- Open any PHP file that WordPress will run. We use
wp-config.phpin this example as it typically runs on every page load. - Set a breakpoint in your PHP file at any point that will be reached during a page visit: click the line number to the left of your code, or choose Run → Toggle Breakpoint → Toggle Line Breakpoint. The line number will turn into a red circle.
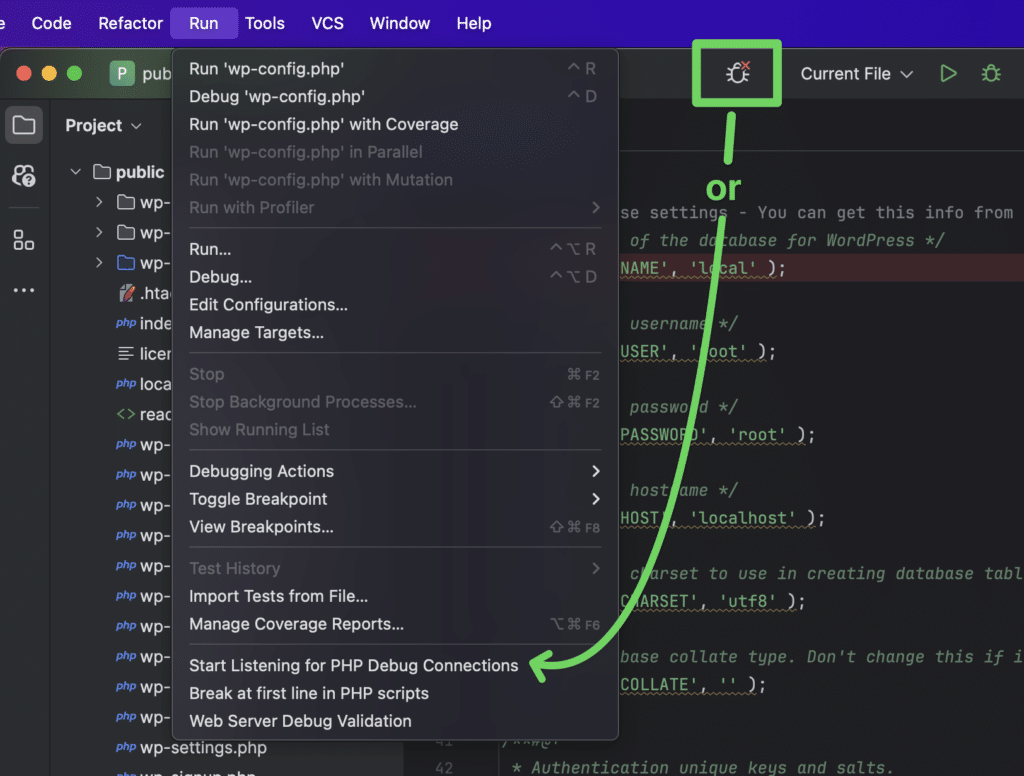
5. PhpStorm: Listen for debug connections
Choose Run → Start Listening for PHP Debug Connections, or click the larger “Bug” icon at the top of the PhpStorm toolbar.
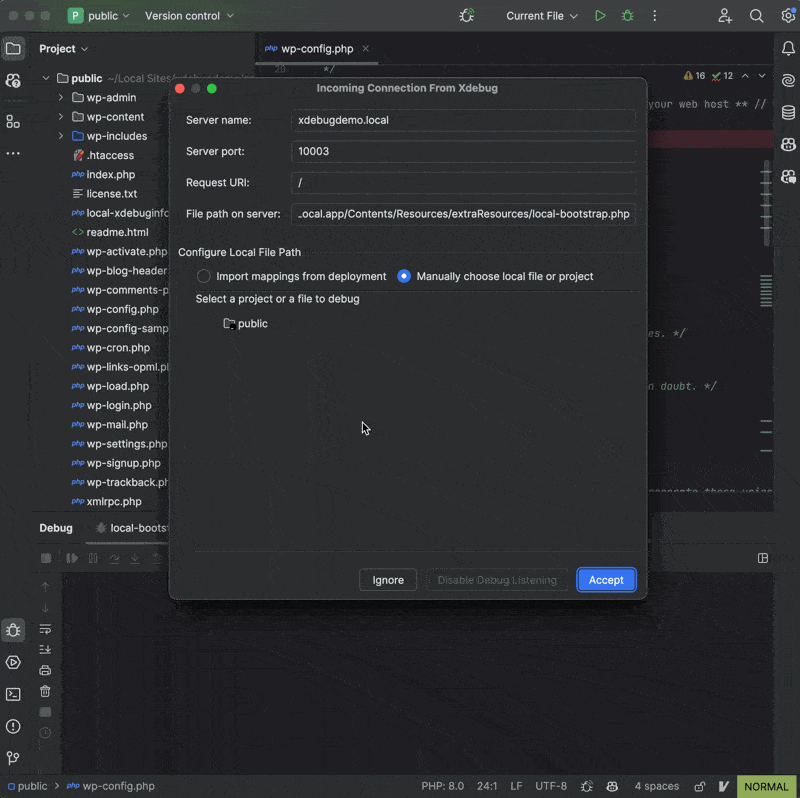
6. PhpStorm: Accept incoming connection from Xdebug
Visit the site in your web browser, for example by clicking “Open Site” in Local.
PhpStorm will show an “Incoming Connection From Xdebug” dialog.
Click the public folder in the “select a project” area, then click Accept.
Inspect your running program
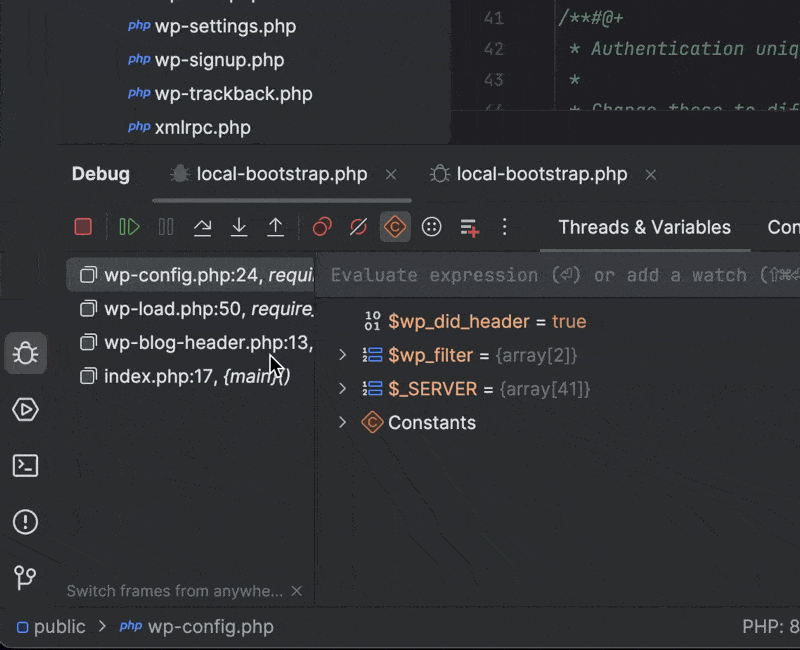
PhpStorm will now freeze execution at your breakpoint. You can step through your code with the controls in PhpStorm’s Debug panel. Learn more about inspecting a running program from JetBrains docs.
In short, you can use the “Threads and Variables” pane to see the value of variables in scope, use “step over”, “step into” and “step through” controls to step through your code, or continue execution to the next breakpoint or the end of your code with “resume program”:
How to stop Xdebug
To stop the debugging session, click the stop button in the debug pane pictured above.
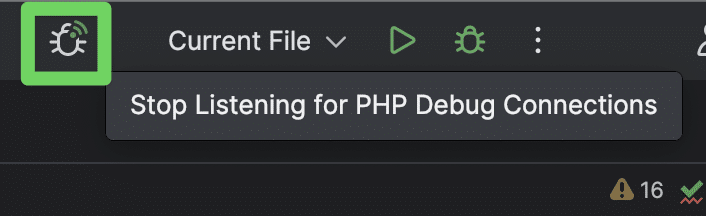
To prevent future sessions from starting, choose Run → “Stop Listening for PHP Debug Connections” in PhpStorm or click the larger bug icon in PhpStorm’s header bar again.
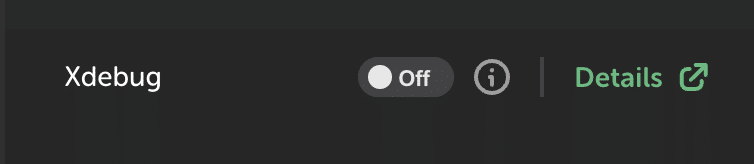
You can also disable Xdebug in Local to stop PhpStorm from freezing execution at breakpoints. When you are not using Xdebug, we recommend leaving it off in Local for improved performance:
Future debugging sessions
Future connections for this site will work automatically and pause execution at breakpoints you set, as long as PhpStorm is set to listen for connections and Xdebug is on in Local. You do not need to run through the above setup every time.
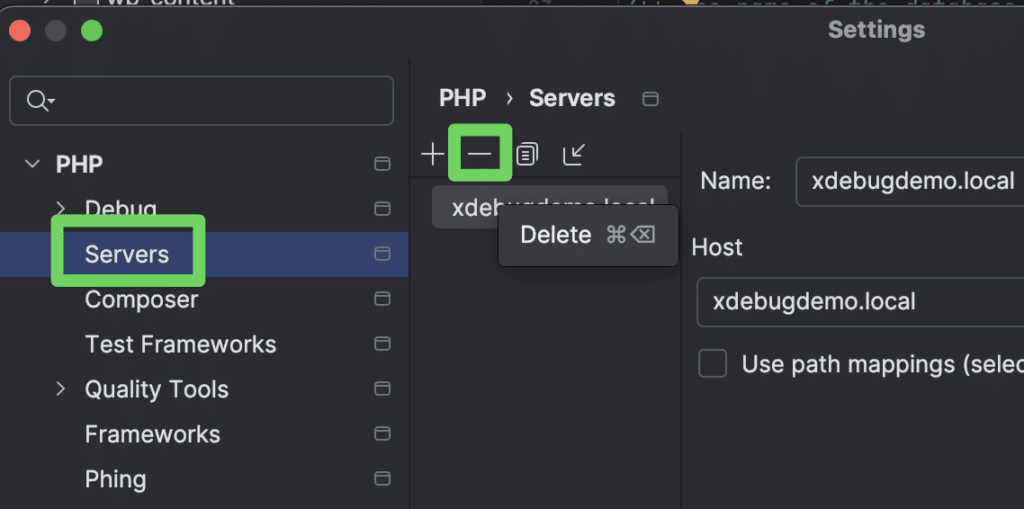
If you want to change your configuration or force the “Incoming Connection” dialog to appear again, delete the PHP → Servers entry in PhpStorm preferences. Then enable Xdebug in Local, listen for debugging connections in PhpStorm, and set a breakpoint. Refresh your browser to present the “Incoming Connection” prompt again.
Troubleshooting
No “Incoming Connection from Xdebug” in PhpStorm when refreshing your browser
- Check that you opened the ‘public’ folder in PhpStorm, not a folder higher up or lower down in the directory tree. If you opened a different folder, open the public folder and turn off the ‘force break’ settings again (see step 3 above).
- Be sure to set a breakpoint in PHP code that will WordPress will run. If you have a breakpoint set in a theme or plugin file, first try a breakpoint in
wp-config.phpto test that Xdebug is working. Xdebug may not reach your current breakpoint if it’s inside an if statement or a file that loads conditionally.
Execution is not frozen at the breakpoint when refreshing your browser
- Check that Xdebug is enabled in Local.
- Confirm that you have enabled “Start Listening for PHP Debug Connections” in PhpStorm.
- Check you have set a breakpoint in PhpStorm.
- Verify that the code on the line of your breakpoint is being executed. For example, you could
var_dump('test');near to that line, confirm that you see the'test'output when refreshing your browser, then set a breakpoint on that line and step through your code from that point.
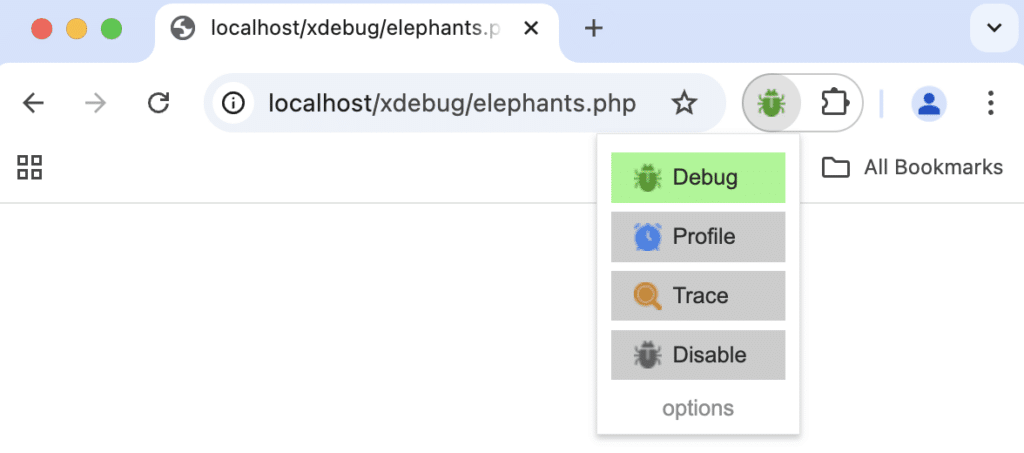
Xdebug browser extension has no effect
You do not need browser extensions like the one pictured below to use Xdebug with Local.
Local sets start_with_request=yes, so all requests will automatically use Xdebug if it’s on in Local and PhpStorm is listening for connections.
No Xdebug option in Local
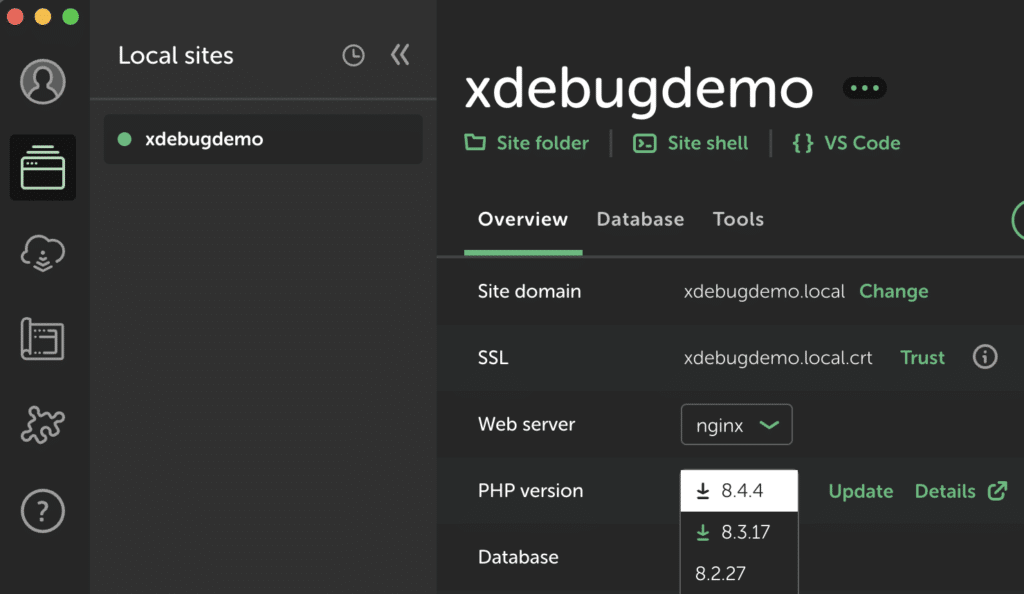
- Try upgrading your site to a newer version of PHP: change the PHP version from the site overview page. The PHP version needs to be 7 or higher.