Xdebug within Local
Xdebug allows you to troubleshoot complicated PHP issues from within the Local app. Xdebug is an extension that can be toggled on or off from within Local.
Table of Contents:
What is Xdebug?
Xdebug is an extension for PHP that helps you with debugging and developing applications.
You’ve probably already run into Xdebug and not been aware of it. The most obvious improvements are:
- Improved formatting of the
var_dump()PHP function. - More informative notices, warnings, and errors.
Because Xdebug does include more information about what is happening when things go wrong, it’s often enabled in development environments like Local.
The above improvements are awesome, but Xdebug also includes a powerful step debugger that is essential for debugging the most complex issues of a PHP project.
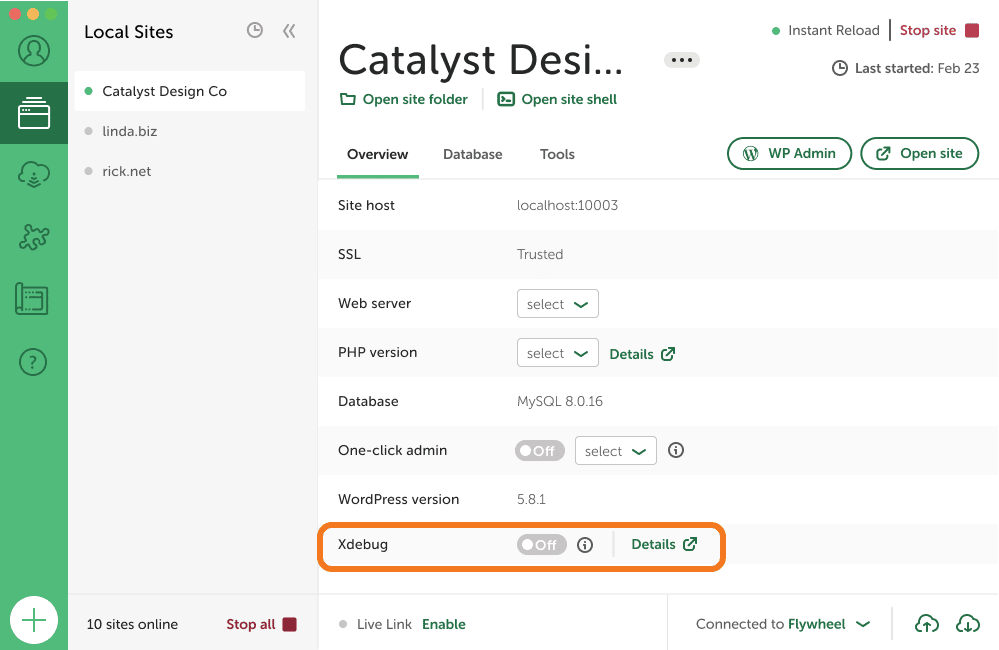
You can toggle Xdebug on or off easily from the app. From your Local app select the site you’d like and the toggle option will be at the bottom of that page.

Xdebug Features
Let’s take a closer look at the main features of Xdebug and how we can make use of them within Local and WordPress.
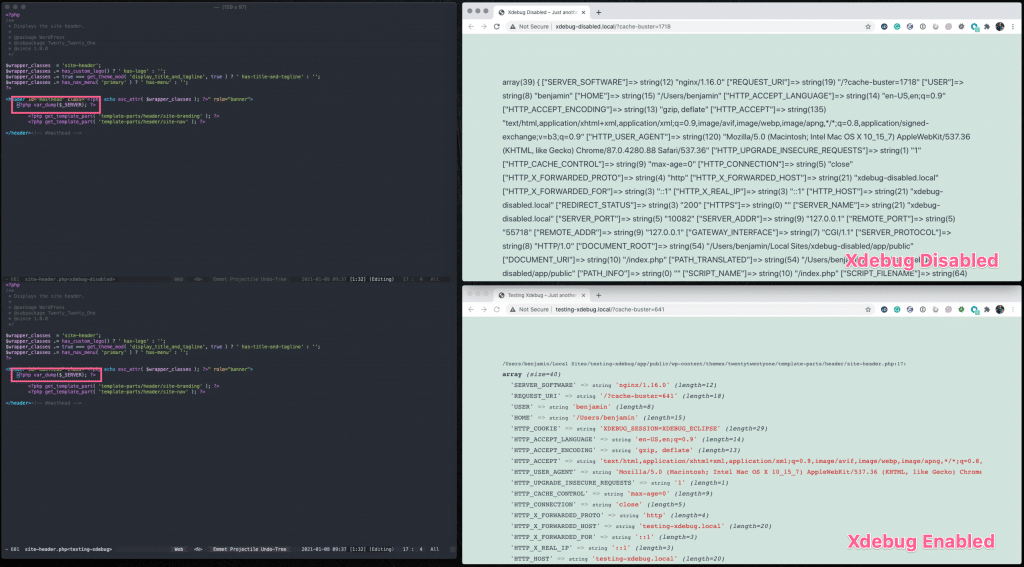
Improvements to var_dump()
The easiest way to dive into an issue and see what’s happening is by using PHP’s var_dump(). Sure, it’s a little hacky to do, but it’s also quick and, more often than not, enough to get you what you need.
Without Xdebug, you have to remember to format PHP in a specific way. When Xdebug is enabled, calling var_dump() produces output that’s both readable and useful.

Better Notices, Warnings, and Errors
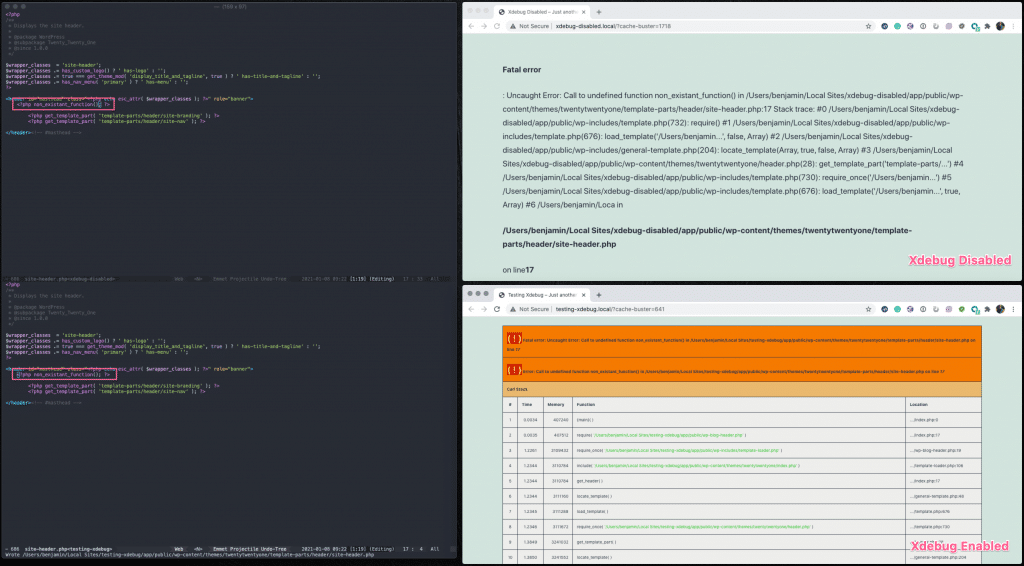
When troubleshooting, one of the most helpful things is to get an idea of where exactly an error is occurring. Xdebug will improve the messages that PHP gives by providing a stack trace. You can think of a stack trace as a list of functions called before the error was encountered.

note
If you’re still new to doing PHP development, this “feature” of Xdebug can be confusing. You might be asking yourself:
“Why does my site look broken in Local but not on Production?”
In some cases, this is because Xdebug enhances these messages (notices, warnings, errors) to make them more “noisy.”
To learn more about this as well as how to configure PHP messages in Local, see this related Help Doc.
Step Debugger
Often, when people think of Xdebug, the step debugger is what comes to mind. This feature allows you to interactively walk through your code and inspect the application’s state at specific points in time.
Each of those points in time is specified by creating a “breakpoint” within the editor. The editor communicates with Xdebug to pause the application at that specific point in the code.
Traditionally it’s been challenging getting Xdebug and your editor of choice to communicate with each other. Local has two Add-ons that help make that configuration process easy; one for PHPStorm and one for VS Code.
Step Debugger Local Addon: Xdebug + VS Code
This Local Add-on helps to configure the connection between Xdebug and VS Code. For more information or to help with development, take a look at these links:
Step Debugger Local Addon: Xdebug + PHPStorm
This Local Add-on helps to configure the connection between Xdebug and PHPStorm. For more information or to help with development, take a look at these links:
- https://localwp.com/add-ons/xdebug-phpstorm/
- https://github.com/getflywheel/local-addon-xdebug-phpstorm
Other Editors
If you have a different editor, you may still be able to use Xdebug’s step debugger within Local. I recommend taking a look at Xdebug’s documentation for specific setings:
Each site’s PHP configuration can be found within the site folder within the PHP.ini file for the site, which can be found in the conf folder:
site-name/conf/php/php.ini.hbs
Make sure to restart the site after any changes to this file so that Local can re-compile those settings for the site.
